
We surveyed 3,200 broadband users across the UK to find out which areas & providers enjoy the most stable connections.
Ever wondered if your broadband deal is as good as it should be? Or if other people are getting better service for less?
Our survey revealed some significant differences in broadband reliability depending on where you live and which provider you’re with.
And when it comes to price, not everyone is getting value for money.
So, which broadband providers are keeping their promises, and which ones are falling short? And if you live in one of the worst areas for outages, what can you do about it? Let’s find out…
How does UK broadband measure up?
Broadband is an essential service, but not all UK households are getting the same experience.
How much do we pay for our broadband?
As a national average, we pay around £38.57 per month for our broadband across the UK.
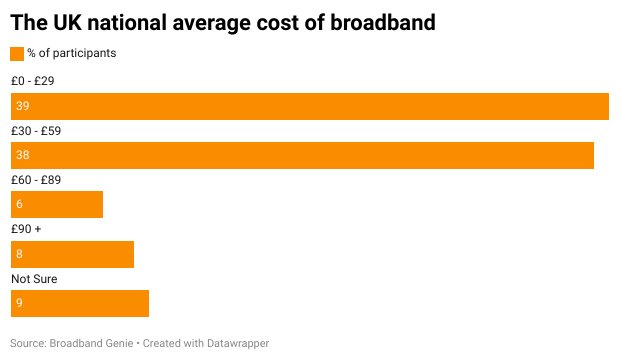
Our survey found that 39% of respondents pay less than £30 per month with a further 38% falling into the £30–£59 range, which aligns closely with the national average.
Meanwhile, 6% of users pay between £60 and £89, and 8% spend £90 or more — often for high-speed fibre packages or bundled services that include TV and phone lines.
But what are people getting in terms of broadband speeds for their money?
Broadband speeds vs costs: are you paying the right price?
Broadband packages in the UK vary widely in speed, but does paying more always mean better service?
Our survey of UK broadband users shows a clear trend: faster speeds generally come at a higher cost, but the price difference isn’t always as big as you might expect.
| What is your advertised broadband speed? | % of participants | Average Price |
|---|---|---|
| Up to 30Mb | 3% | £26.73 |
| 30 - 60Mb | 8% | £29.31 |
| 61 - 100Mb | 12% | £29.23 |
| 101 - 300Mb | 17% | £31.67 |
| 301 - 900Mb | 10% | £35.11 |
| 900+ Mb | 8% | £45.35 |
Looking at the data, the difference between basic and mid-tier broadband isn’t huge, with users upgrading from 30Mb to 100Mb speeds for just a few extra pounds per month.
However, those opting for ultrafast (900Mb+) services are paying a premium, with costs rising significantly.
For many households, the best value sits in the 101–300Mb range, where speeds are fast enough for most modern needs without the hefty price tag of gigabit broadband. However, for gamers, large households, or those working from home, the higher-cost ultrafast options may still be worth the investment.
Next, we’ll dive into how actual broadband performance compares to these advertised speeds. Are customers really getting what they pay for?
The best providers for internet reliability
When it comes to broadband, speed is important, but reliability is what really matters. There’s nothing more frustrating than constant dropouts, buffering, or slow connections when you need them most. Our survey reveals which providers consistently deliver stable connections and which ones leave customers dealing with frequent outages.
Which broadband providers can you count on, and which ones fall short? Let’s have a look at the results.
| Rank | Internet Provider | People with zero outages | 1+ outages | 4+ outages | 7+ outages | 10+ outages | Score |
|---|---|---|---|---|---|---|---|
| 1 | Utility Warehouse | 93% | 7% | 0% | 0% | 0% | 92.14 |
| 2 | BT | 81% | 19% | 5% | 2% | 1% | 75.28 |
| 3 | TalkTalk | 77% | 23% | 5% | 2% | 2% | 69.47 |
| 4 | Plusnet | 72% | 28% | 7% | 1% | 0% | 65.26 |
| 5 | Virgin Media | 70% | 30% | 7% | 3% | 2% | 60.42 |
| 6 | Sky | 69% | 31% | 9% | 3% | 1% | 59.61 |
| 7 | Community Fibre | 69% | 31% | 14% | 8% | 3% | 52.22 |
| 8 | NOW Broadband | 62% | 38% | 16% | 0% | 0% | 51.75 |
| 9 | Hyperoptic | 65% | 35% | 17% | 4% | 0% | 51.74 |
| 10 | Vodafone | 63% | 37% | 12% | 3% | 1% | 50.96 |
| 11 | EE | 60% | 40% | 13% | 2% | 0% | 49.12 |
| 12 | Youfibre | 60% | 40% | 23% | 3% | 0% | 44.33 |
| 13 | Zen Internet | 53% | 47% | 20% | 2% | 0% | 39.11 |
| 14 | KCOM | 46% | 54% | 15% | 3% | 0% | 32.82 |
| 15 | Origin | 53% | 47% | 29% | 5% | 0% | 32.63 |
| 16 | Trooli | 47% | 53% | 24% | 12% | 0% | 24.12 |
| 17 | Three Broadband | 40% | 60% | 25% | 4% | 0% | 21.27 |
| 18 | Direct Save | 32% | 68% | 21% | 0% | 0% | 16.32 |
| 19 | Gigaclear | 30% | 70% | 30% | 5% | 0% | 7.50 |
| 20 | BeFibre | 20% | 80% | 30% | 3% | 0% | -2.33 |
| 21 | Cuckoo | 12% | 88% | 47% | 12% | 0% | -24.12 |
Our survey identified 70 different broadband providers, but many had too few respondents to provide meaningful insights. To ensure accuracy, we focused only on those with a significant number of users, removing smaller providers from this analysis.
That leaves us with 21 of the UK's top broadband providers, and the results were interesting, to say the least.
Utility Warehouse takes the top spot, with an impressive 93% of its customers reporting zero outages. This makes it the clear leader in broadband reliability, with virtually no users experiencing regular disruptions. BT follows in second place, with 81% of users enjoying uninterrupted service, while TalkTalk ranks third with 77%.
At the other end of the scale, Cuckoo, BeFibre, and Gigaclear performed the worst, with 88%, 80%, and 70% of users respectively reporting at least one outage. Cuckoo stands out as the least reliable provider, with nearly half of its users experiencing four or more outages -a worrying statistic for anyone relying on their internet for work or streaming.
How do the major providers compare?
Among the biggest names in UK broadband, the rankings show a clear divide in reliability:
- BT (81%) and TalkTalk (77%) performed well, with the majority of customers avoiding outages.
- Virgin Media (70%) and Sky (69%) ranked lower, with around 30% of their users experiencing at least one outage.
- Vodafone (63%) and EE (60%) didn’t fare as well, with over a third of their customers affected by downtime.
One of the most surprising findings is that Community Fibre, a provider known for its full-fibre service, struggled with reliability, with 31% of users reporting outages and 14% facing four or more disruptions. This suggests that even fibre providers aren’t immune to connection issues.
The results indicate that while big names like BT and TalkTalk offer relatively stable service, some lesser-known providers, such as Utility Warehouse, outperform them when it comes to avoiding outages.
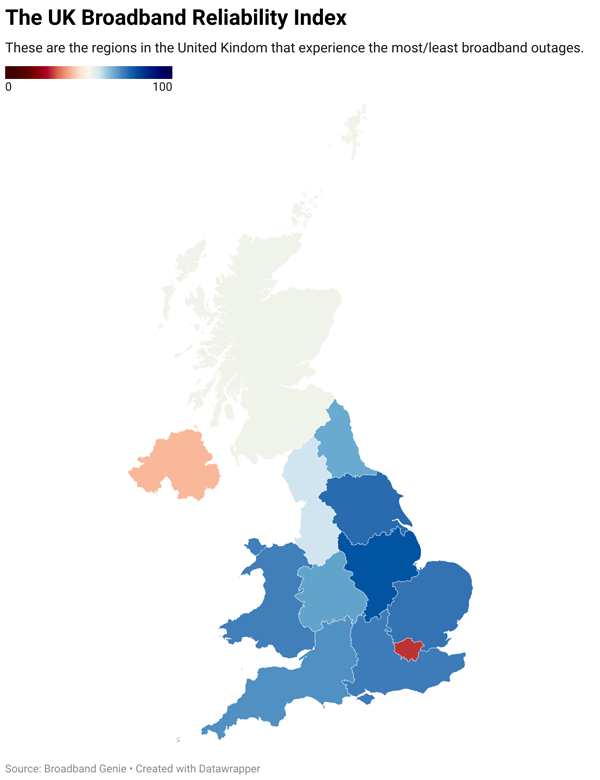
Where in the UK has the most reliable broadband?
Broadband reliability isn’t just about your provider—it also depends on where you live. Our survey reveals that some areas in the UK enjoy far more stable connections than others, while certain cities struggle with frequent outages.
Which locations have the best broadband reliability, and where are users most likely to experience dropouts? Here are our findings:
The most reliable regions for broadband
| Rank | Region | People with zero outages | 1+ outages | 4+ outages | 7+ outages | 10+ outages | Score |
|---|---|---|---|---|---|---|---|
| 1 | East Midlands | 82% | 18% | 4% | 1% | 0% | 77.11 |
| 2 | Yorkshire and the Humber | 79% | 21% | 5% | 1% | 0% | 73.64 |
| 3 | East of England | 78% | 22% | 4% | 1% | 1% | 72.50 |
| 4 | South East | 79% | 21% | 6% | 2% | 1% | 71.12 |
| 5 | Wales | 77% | 23% | 8% | 1% | 0% | 70.71 |
| 6 | South West | 76% | 24% | 5% | 3% | 1% | 68.25 |
| 7 | West Midlands | 75% | 25% | 7% | 4% | 2% | 65.61 |
| 8 | North East | 73% | 27% | 6% | 3% | 1% | 64.62 |
| 9 | North West | 67% | 33% | 7% | 3% | 1% | 57.18 |
| 10 | Scotland | 67% | 33% | 15% | 7% | 1% | 51.47 |
| 11 | Northern Ireland | 49% | 51% | 9% | 1% | 0% | 39.74 |
| 12 | London | 43% | 57% | 21% | 3% | 0% | 27.21 |
The most reliable cities for broadband
| Rank | City | People with zero outages | 1+ outages | 4+ outages | 7+ outages | 10+ outages | Score |
|---|---|---|---|---|---|---|---|
| 1 | Gloucester | 92% | 8% | 0% | 0% | 0% | 91.20 |
| 2 | Wolverhampton | 86% | 14% | 3% | 0% | 0% | 83.10 |
| 3 | Worcester | 83% | 17% | 0% | 0% | 0% | 80.90 |
| 4 | Oxford | 84% | 16% | 5% | 0% | 0% | 80.60 |
| 5 | Sheffield | 83% | 17% | 5% | 1% | 0% | 79.20 |
| 6 | Wrexham | 82% | 18% | 2% | 0% | 0% | 79.10 |
| 7 | Norwich | 81% | 19% | 3% | 1% | 1% | 76.40 |
| 8 | Leicester | 79% | 21% | 6% | 1% | 0% | 73.80 |
| 9 | Leeds | 79% | 21% | 7% | 1% | 0% | 73.60 |
| 10 | Southampton | 81% | 19% | 9% | 2% | 1% | 72.70 |
| 11 | Cardiff | 76% | 24% | 7% | 1% | 0% | 70.40 |
| 12 | York | 76% | 24% | 6% | 1% | 1% | 69.40 |
| 13 | Newcastle | 76% | 24% | 5% | 3% | 1% | 68.50 |
| 14 | Swansea | 74% | 26% | 13% | 0% | 0% | 66.50 |
| 15 | Birmingham | 74% | 26% | 5% | 2% | 1% | 66.20 |
| 16 | Liverpool | 72% | 28% | 4% | 1% | 1% | 65.60 |
| 17 | Cambridge | 76% | 24% | 7% | 4% | 4% | 64.50 |
| 18 | Plymouth | 71% | 29% | 3% | 3% | 1% | 64.00 |
| 19 | Bristol | 73% | 27% | 9% | 3% | 2% | 62.70 |
| 20 | Edinburgh | 71% | 29% | 12% | 4% | 1% | 59.60 |
| 21 | Portsmouth | 74% | 26% | 7% | 7% | 5% | 59.50 |
| 22 | Aberdeen | 63% | 37% | 3% | 0% | 0% | 58.42 |
| 23 | Manchester | 63% | 37% | 8% | 4% | 1% | 52.43 |
| 24 | Chelmsford | 63% | 37% | 16% | 1% | 0% | 51.91 |
| 25 | Coventry | 67% | 33% | 10% | 6% | 4% | 51.63 |
| 26 | Brighton and Hove | 64% | 36% | 15% | 4% | 2% | 49.24 |
| 27 | Glasgow | 64% | 36% | 20% | 10% | 1% | 44.11 |
| 28 | London | 55% | 45% | 15% | 2% | 0% | 42.21 |
| 29 | Belfast | 49% | 51% | 9% | 1% | 0% | 39.74 |
How many of us work from home?
With the Covid pandemic came a new way of working. Suddenly, a sizeable percentage of us began working from home.
That means broadband reliability in our homes became a critical factor in ensuring we could stay connected to work and maintain productivity without constant disruptions. A slow or unreliable connection wasn’t just frustrating - it could mean missed deadlines, frozen video calls, and a whole lot of stress.
With remote and hybrid working now a permanent fixture for many, a reliable broadband connection is more important than ever.
But are UK households actually getting the speeds and stability they need? Let’s take a look at how broadband performance stacks up in the various cities across the UK:
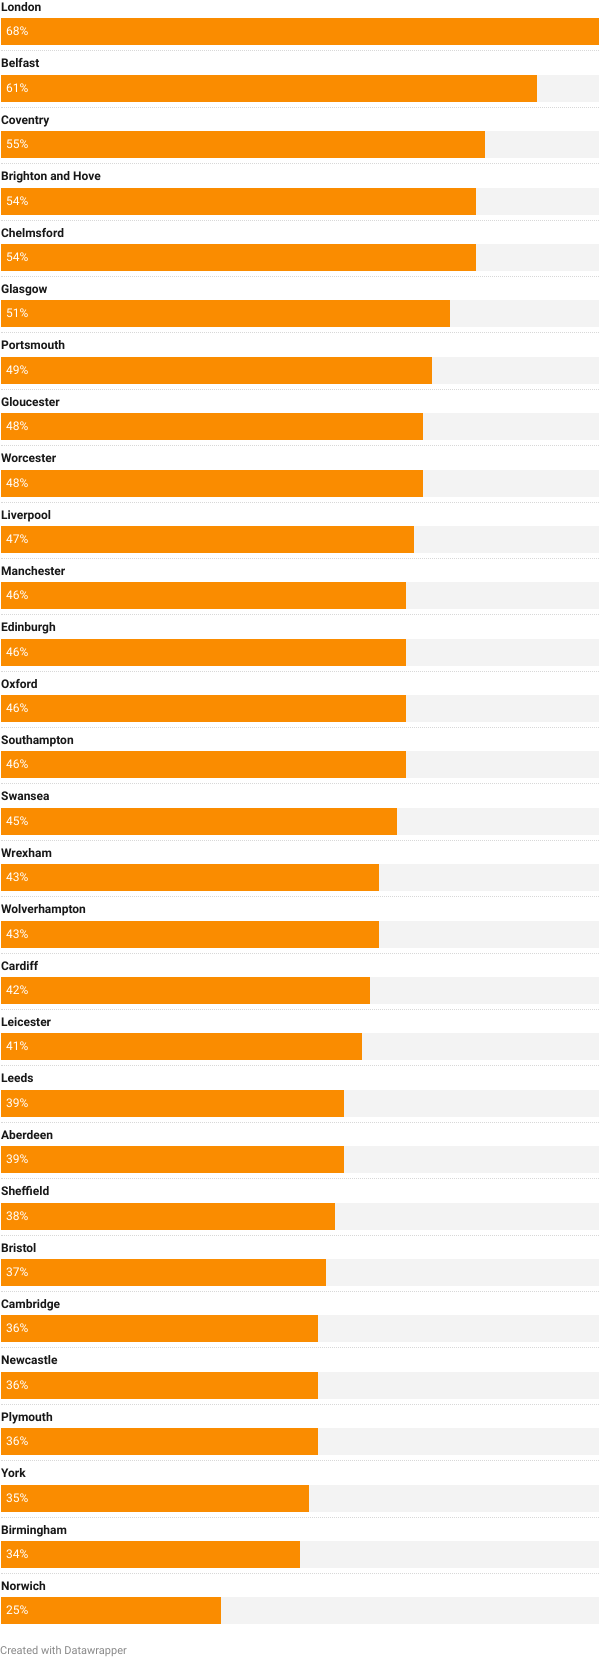
London (68%) and Belfast (61%) have the highest percentages of people working from home at least one day a week, yet these cities also ranked among the worst for broadband reliability. This is particularly shocking given that both are major urban hubs with access to high-speed infrastructure.
What can you do if you’re affected by outages?
We’ve published advice on what to do if your Wi-Fi goes down in the past, so if you’ve followed those instructions and nothing has worked, the problem likely rests with your provider.
If your issue lasts for more than a day, you could be due compensation from your broadband provider.
How much compensation am I due for a broadband outage?
When we asked our survey participants how much they should be compensated. The majority (25%) went with £10 a day. Which is handy! That’s very close to the official figure of £9.76 per day offered by providers who are a part of Ofcom’s automatic compensation scheme.
In short, this scheme means providers must pay if your broadband (or landline) is out of commission after two working days of you reporting the fault.
Here are the providers who currently take part in the scheme:
- BT
- EE
- Hyperoptic
- Plusnet
- Sky (including NOW Broadband)
- TalkTalk
- Utility Warehouse
- Virgin Media
- Vodafone
- Zen Internet
If you’re with any of those providers, you’re in luck: all you’ll need to do is report the fault.
If you’re with a provider who isn’t a part of that scheme, you may have your work cut out for you.
How to claim compensation if your provider isn’t part of the scheme
If your broadband provider isn’t part of Ofcom’s automatic compensation scheme, getting reimbursed for an outage can be more challenging, but not impossible. Here’s what you can do:
- Check your provider’s compensation policy: Even if they’re not signed up for the scheme, many providers have policies for compensating customers affected by outages. Check their website or contact customer service to see what they offer.
- Keep a record of outages: If you experience a broadband failure, note down the date, time, and duration of the outage. If you rely on the internet for work, you may also want to track any financial losses or missed opportunities caused by the downtime.
- Report the fault ASAP: Make sure you report the issue to your provider as soon as possible. Some companies will only consider compensation claims if the outage has been officially logged.
- Request compensation directly: If your broadband was down for a significant period, reach out to your provider and request compensation. Use the official Ofcom rate (£9.76 per day) as a guideline for what’s fair. If your provider refuses, ask them to explain why.
- Escalate your complaint: If your provider refuses to compensate you, but you feel you have a valid claim, you can escalate the issue by complaining to the Communications Ombudsman or CISAS, depending on which dispute resolution scheme your provider is signed up to.
Frequent broadband outages aren’t just frustrating, they can also mean you’re paying for a service that isn’t delivering.
If your provider isn’t meeting expectations and refuses to compensate you, it might be time to switch.
-
Methodology
The Broadband Reliability Score was calculated as follows:
Base score calculation: The percentage of people who experienced zero outages was multiplied by 100, giving an initial score out of 100.
Deductions for outages: Penalties were applied based on the number of outages reported:
1 or more outages: each instance was multiplied by 10
4 or more outages: each instance was multiplied by 40
7 or more outages: each instance was multiplied by 70
10 or more outages: each instance was multiplied by 100Final score calculation: The total penalties were subtracted from the base score, resulting in the final Broadband Reliability Score.
Providers with fewer than 10 customers represented in the survey were excluded due to lack of proper representation. The number of people who were reported as 0 outages included those who answered: “I don’t know/ I don’t remember” within the survey.